MRC Early Alert Tool
Note: This tool is a predictive model. This means that the bacteria concentration levels are predictive levels, and do not reflect actual levels of E. coli. In addition, the Early Alert Tool reflects risk for E. coli only; river flow and velocity, outside sources of pollution, and other health risks are not accounted for. Please recreate in the river at your own discretion.
About the Early Alert Tool
The Merrimack River Early Alert tool is a multimodal resource for data sharing, result prediction, and real-time monitoring. This “Early Alert Tool”, consists of an AI-powered model and online dashboard, and serves a critical role in predicting water quality downstream of Wastewater Treatment Plants (WWTPs) after combined sewer overflow (CSO) events. With this prediction, an evaluation is made of the associated risk level for residents interacting with the river. This resource aids municipal Boards of Health in adhering to the Massachusetts Department of Environmental Protection (DEP) legislation regarding mandatory postings at public access points to the Merrimack River after CSO events.
Funding for this tool
The Merrimack Valley Planning Commission has been awarded funding from the State’s Community Compact Cabinet Regionalization and Efficiency Grant Program to enhance their Combined Sewage Overflow (CSO) monitoring tool.
How to use this tool
River Segments
There are four river segments on the map below. Each segment has been chosen due to it’s proximity to combined sewer overflows (CSOs). As CSOs are activated, the corresponding river segment will change from green to red. Once a river segment no longer has an active CSO, the segment will change to yellow, indicating a recently active CSO within the river segment. If there has been no further CSO activity after 48 hours, the yellow segment will change to back to green. Click each segment for a more in-depth look.
CSO Outfalls
Combined sewer overflow (CSO) outfalls are marketed by either green, yellow, or red circles depending on their activity. Green indicates an inactive CSO, yellow a recently active CSO, and red indicates an active CSO. Click on each CSO marker for a more in-depth look.
Outfall Activity by Municipality
The chart titled “Outfall Activity by Municipality” on the “CSO Activity” tab shows the status of all of the CSOs. As municipalities experience rainfall, each municipality’s column will display a different color to reflect the activity of each CSO. Green segments of the bar chart represent inactive CSOs. Yellow represent recently active (within 48 hours), and red represents active CSOs.
Questions or Concerns?
Is it safe to swim?
Understanding Risks Associated with CSO Events

Combined Sewer Overflow (CSO) events occur when there is heavy rainfall that triggers a combined sewer system to get overwhelmed, leading to household sewage to be discharged into a nearby body of water. CSOs cause the bacteria concentration in the water to reach dangerously high levels. When this occurs, it is unsafe to interact with the river due to increased health risks caused by the bacteria. For more information on CSO’s, read our article on CSO Frequently Asked Questions.
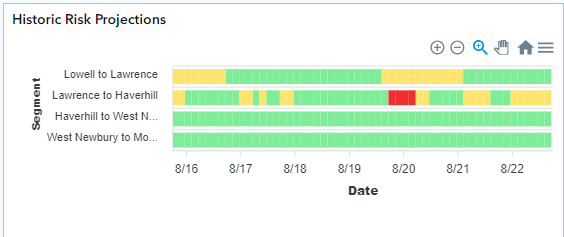
As CSOs change from active to inactive and inactive to active, the previous 7-days of data for CSO activity is stored and displayed on the chart labeled “Historic Risk Projections” within the dashboard. Find which river segment you are interested in, and and compare today’s data to previous day’s data. Knowing previous river data can help you make informed decisions around river recreation.
Low Risk
Green indicates low E. coli levels, making it safe to swim and recreate in the river.
—
E. coli “low risk” levels: < 100 mpn/100mL
Medium Risk
Yellow indicates moderate E. coli levels, in which non-contact activity (such as kayaking), is recommended in the river.
—
E. coli “medium risk” levels: 100 – 400 mpn/100mL
High Risk
Red indicates high E. coli levels, making it unsafe to recreate in the river.
—
E. coli “high risk” levels: > 400 mpn/100mL
How Risk Levels Are Defined
“Low”, “Medium”, and “High” risk levels are EPA’s recommended criteria for E. coli levels. For more information on EPA’s E. coli recommendations, please follow this link.
About this Tool
Predictive Modeling
The Early Alert tool is utilized to enhance Combined Sewage Overflow (CSO) monitoring events. This tool incorporates AI technology and predictive modeling to predict water quality downstream to Wastewater Treatment Plants (WWTPs) after CSO events. This resource will assess the associated risk level for residents interacting with the river.
Data Collection
The Tool uses water quality samples pulled after CSO events to build an understanding of bacteria levels after heavy precipitation. To learn more about the water quality monitoring program lead by the Merrimack River Watershed Council, follow this link.
